How Can We Help?
Basic Digital Imaging Notions For The Life Scientist
The corresponding Python Jupyter Notebook can be found here for those interested in coding examples :
https://github.com/UniversalBuilder/Resources-for-the-Life-Scientist
1) A digital image is just a table of numbers
A digital image is just a table of numbers or a set of tables in the case of multiple channels that represent the pixels and their respective intensities.
To illustrate this concept, we can fill a table with random values of 0 and 1 and display it as an image, and compare it to an actual image:
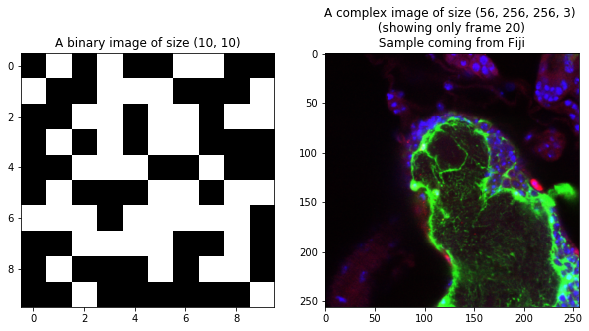
The right image is a sample from Fiji with 3 channels and 56 slices.
We can display some of their values to understand how they are encoded :
Binary image:

    0  1  2  3  4  5  6  7  8  9
0  0  1  0  1  0  0  1  1  0  0
1  1  0  0  1  1  1  0  0  0  1
2  0  0  1  1  0  1  1  0  1  1
3  0  1  0  1  0  1  1  0  0  0
4  0  0  1  1  1  0  0  1  0  0
5  0  1  0  0  0  1  1  0  1  1
6  1  1  1  0  1  1  1  1  1  0
7  0  0  1  1  1  1  0  0  1  0
8  0  1  0  0  0  1  0  1  1  0
9  0  0  1  0  0  0  0  0  0  1

Big image:

 [[[  4   1   2]
  [  4   1   2]
  [  5   1   2]
  ...
  [ 58  68  36]
  [ 60  68  35]
  [ 45  41  26]]

 [[  4   1   2]
  [  4   1   2]
  [  6   1   3]
  ...
  [ 60  65  33]
  [ 62  69  32]
  [ 54  42  27]]

 [[  4   1   2]
  [  4   1   2]
  [  5   1   2]
  ...
  [ 67  54  32]
  [ 61  56  30]
  [ 57  29  25]]

 ...

 [[  8   0   7]
  [ 10   1   6]
  [ 11   1   9]
  ...
  [ 60 144 138]
  [ 62 154 184]
  [ 71 169 164]]

 [[  6   0   5]
  [  8   0   5]
  [ 12   0   6]
  ...
  [ 59 105 176]
  [ 58 138 241]
  [ 72 179 218]]

 [[ 10   2   7]
  [  9   2   6]
  [ 12   2   6]
  ...
  [ 58 103 183]
  [ 68 128 224]
  [ 61  91 219]]]
2) Bit Depth
The pixels have values. The range of these values is depending on the bit depth chosen by the user or decided by the device used to produce the image.
Here are several images with different bitdepth
3) Image size
Commonly, people refer to image size as how large they see the image displayed. An image’s digital size (or dimension) is only defined by its size in pixels.
On the other hand, the way a digital image is displayed in physical size depends also on the characteristics of the medium it is represented on. If the medium allows it, it can also be decided by the user.
A computer screen has a fixed number of pixels of fixed size, allowing only 1 true 100% representation of the data. Every other representation will rely on interpolation.
Paper has no such limitation and the user can decide what size the pixels should be and have multiple 100% representations. There no true 100% representation of a digital image on paper since the pixel itself is interpolated and created by the printer that decides how many drops of inks it needs to represent it.
When printing an image, the user has to decide what size the pixels of image should be, but also he can also decide what size to overall image should be by relying on interpolation.
If the user doesn’t want to use interpolation when printing to avoid resizing artifacts, then the size of the image is solely decided by its pixel size, which is represented by a number, the number of DPI or Dots Per Inches.
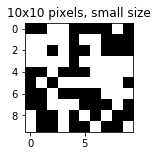
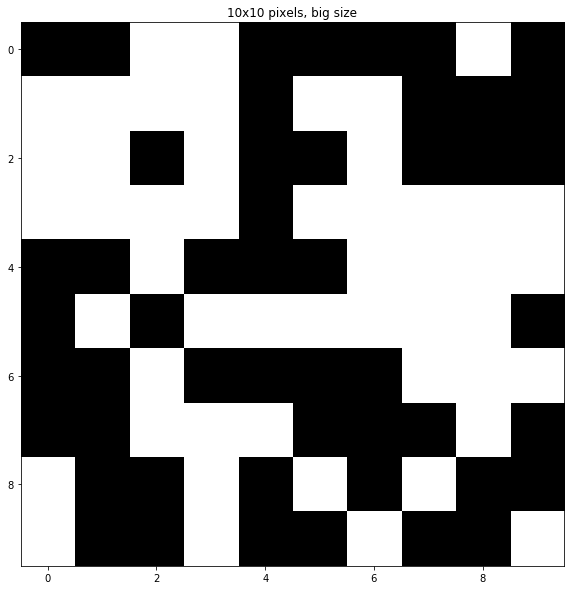
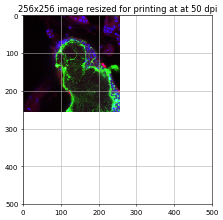
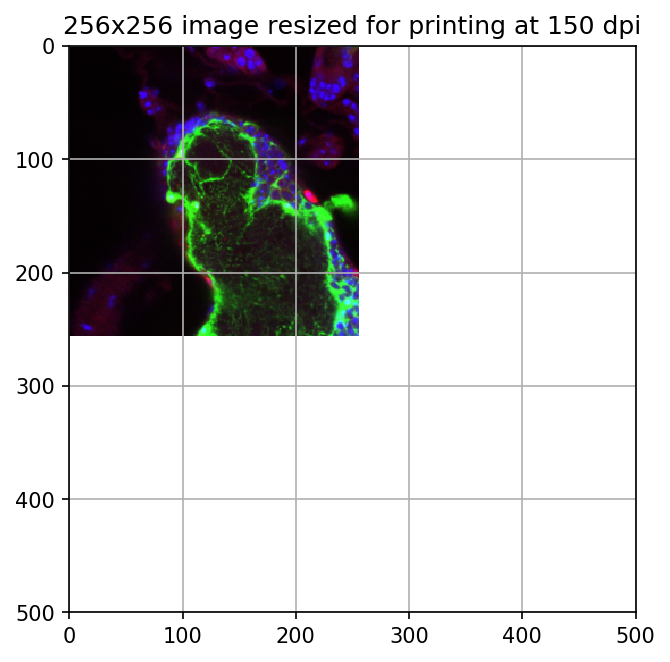
3.1) Physical size
As an example, here’s the same image displayed at two different physical sizes on your screen. The interpolation is handled by the drawing engine of the matplotlib library used to represent these images.
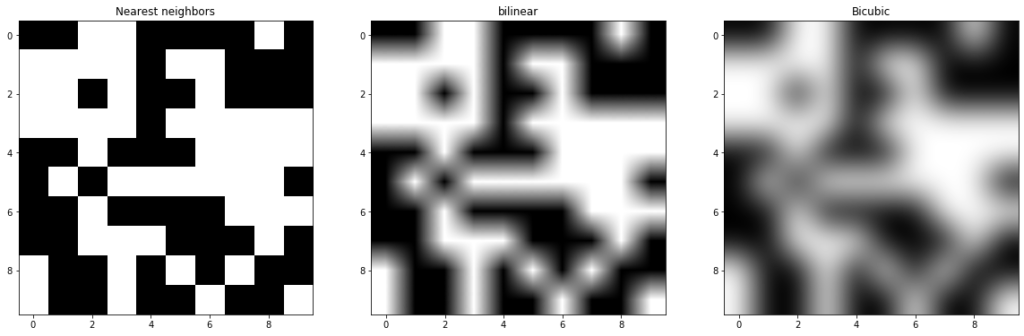
3.2) Interpolation
If you represent each pixel of the image with a single pixel on your computer screen, you are viewing the image in its real dimension, or often refered to as 100% magnification.
In every other cases you are actually using an interpolation to
- recreate the missing pixels if you are upscaling the image, or
- finding the most reprensentative value of a group of pixels if you are downscaling the image.
Here are some examples with our 10×10 pixels image:
3.3) DPI
DPI stand for Dots Per Inch. It represents the number of pixels printed per inch on a paper medium. DPI has no meaning outside of printing.
DPI is inherently related to the medium supporting the image: a computer screen has a certain number of physical pixels that cannot change. If you count the number of pixels of this screen along one inch, you are measuring its DPI.
TIP : Since this is the only value it can take, there is no point of using it if you never plan to print the image, because changing this value on Photoshop for example (without changing the pixel dimension !) will not change the image size on the screen.
Media like paper do not have inherent DPI limitations like computer screens, and the user can decide at which DPI he wants to print an image.
Another way of putting it is that DPI is the resolution at which a digital image will be printed on a specific medium.
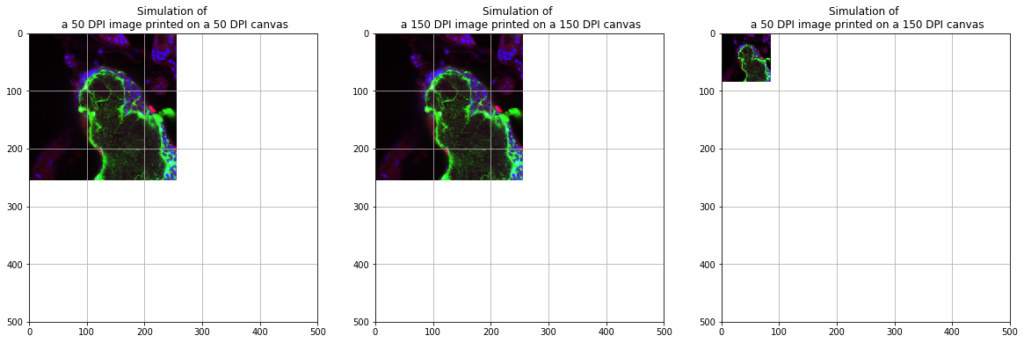
Here’s an example of how the same image would print with different print settings:
A ) A figure’s size when set to be printed on a 50 dpi paper
- The image data is 256×256 pixels
- The image is drawn on a canvas of 500×500 pixels of the same size as the data
- The figure‘s size is then scaled to make sure you have 50 pixels per inch on the paper when printed at 50 DPI
- The figure‘s resolution is 50 DPI.
B) The same figure’s size when set to be printed on a 150 dpi paper.
- The image data is 256×256 pixels
- The image is drawn on a canvas of 500×500 pixels of the same size as the data
- The figure‘s size is then scaled to make sure you have 150 pixels per inch on the paper when printed at 150 DPI
- The figure‘s resolution is 150 DPI.
C) Comparison of printing simulations
Both pictures will appear as having the same physical size when printed respectively on 50 DPI and 150 DPI canvas, but printing an image scaled for 50 DPI on a 150 DPI canvas will have it appear 3 times smaller.
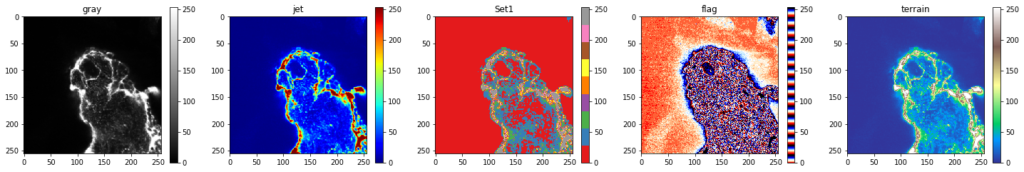
4) Colors in a mono channel digital image and LUTs
If you consider a single channel 12-bit digital image, a single number per pixel represents the intensity of the signal. Without additional information, there is no specific color tied to the pixel values in the data itself.
You can represent these values using gray levels, which is often the default in life science. But you can also use a LUT (lookup table) or Colormap to assign a specific color to each value and create an artificial color representation of your data.
Some colormaps are gradients from dark (low intensities) to light (high intensities), but there is also specialized colormaps than can highlight a change in intensity or texture, split your data into several classes, or mimic reality with a colorized version of a black and white image like a satellite image of an island.
Here is the exact same image, but represented using different colormaps:
- gray : default
- jet : highlight high intensities
- Set1 : divide image into classes
- flag : highlight areas with high or low variabilities (texture)
- terrain : mimics a satellite view of land